Melissa Wilson Wilder
I save wild places for wild people.

Figure 1. Scenic trails and the wild, connected and diverse U.S. Represents the top 95%, 90%, 80%, 75% and 50% wildland values (Belote et al., 2017), wildness (Venter et al., 2017), corridor value (Belote et al., 2016), forward centrality (Caroll et al., 2018), species richness (McKerrow et al., 2018), biodiversity priority (Jenkins et al., 2014), and ecosystem representation (Aycrigg et al., 2014) in the contiguous United States.

Figure 4. Comparisons between three modeled relationships between wildness and permeability to identify greater ecosystems around parks. Equation for model P =100-99*((1-exp(c*W)/(1-exp(c))), where P is permeability, C is the curve variable, and W is the percent of wildness (Adapted from Keeley, 2016).
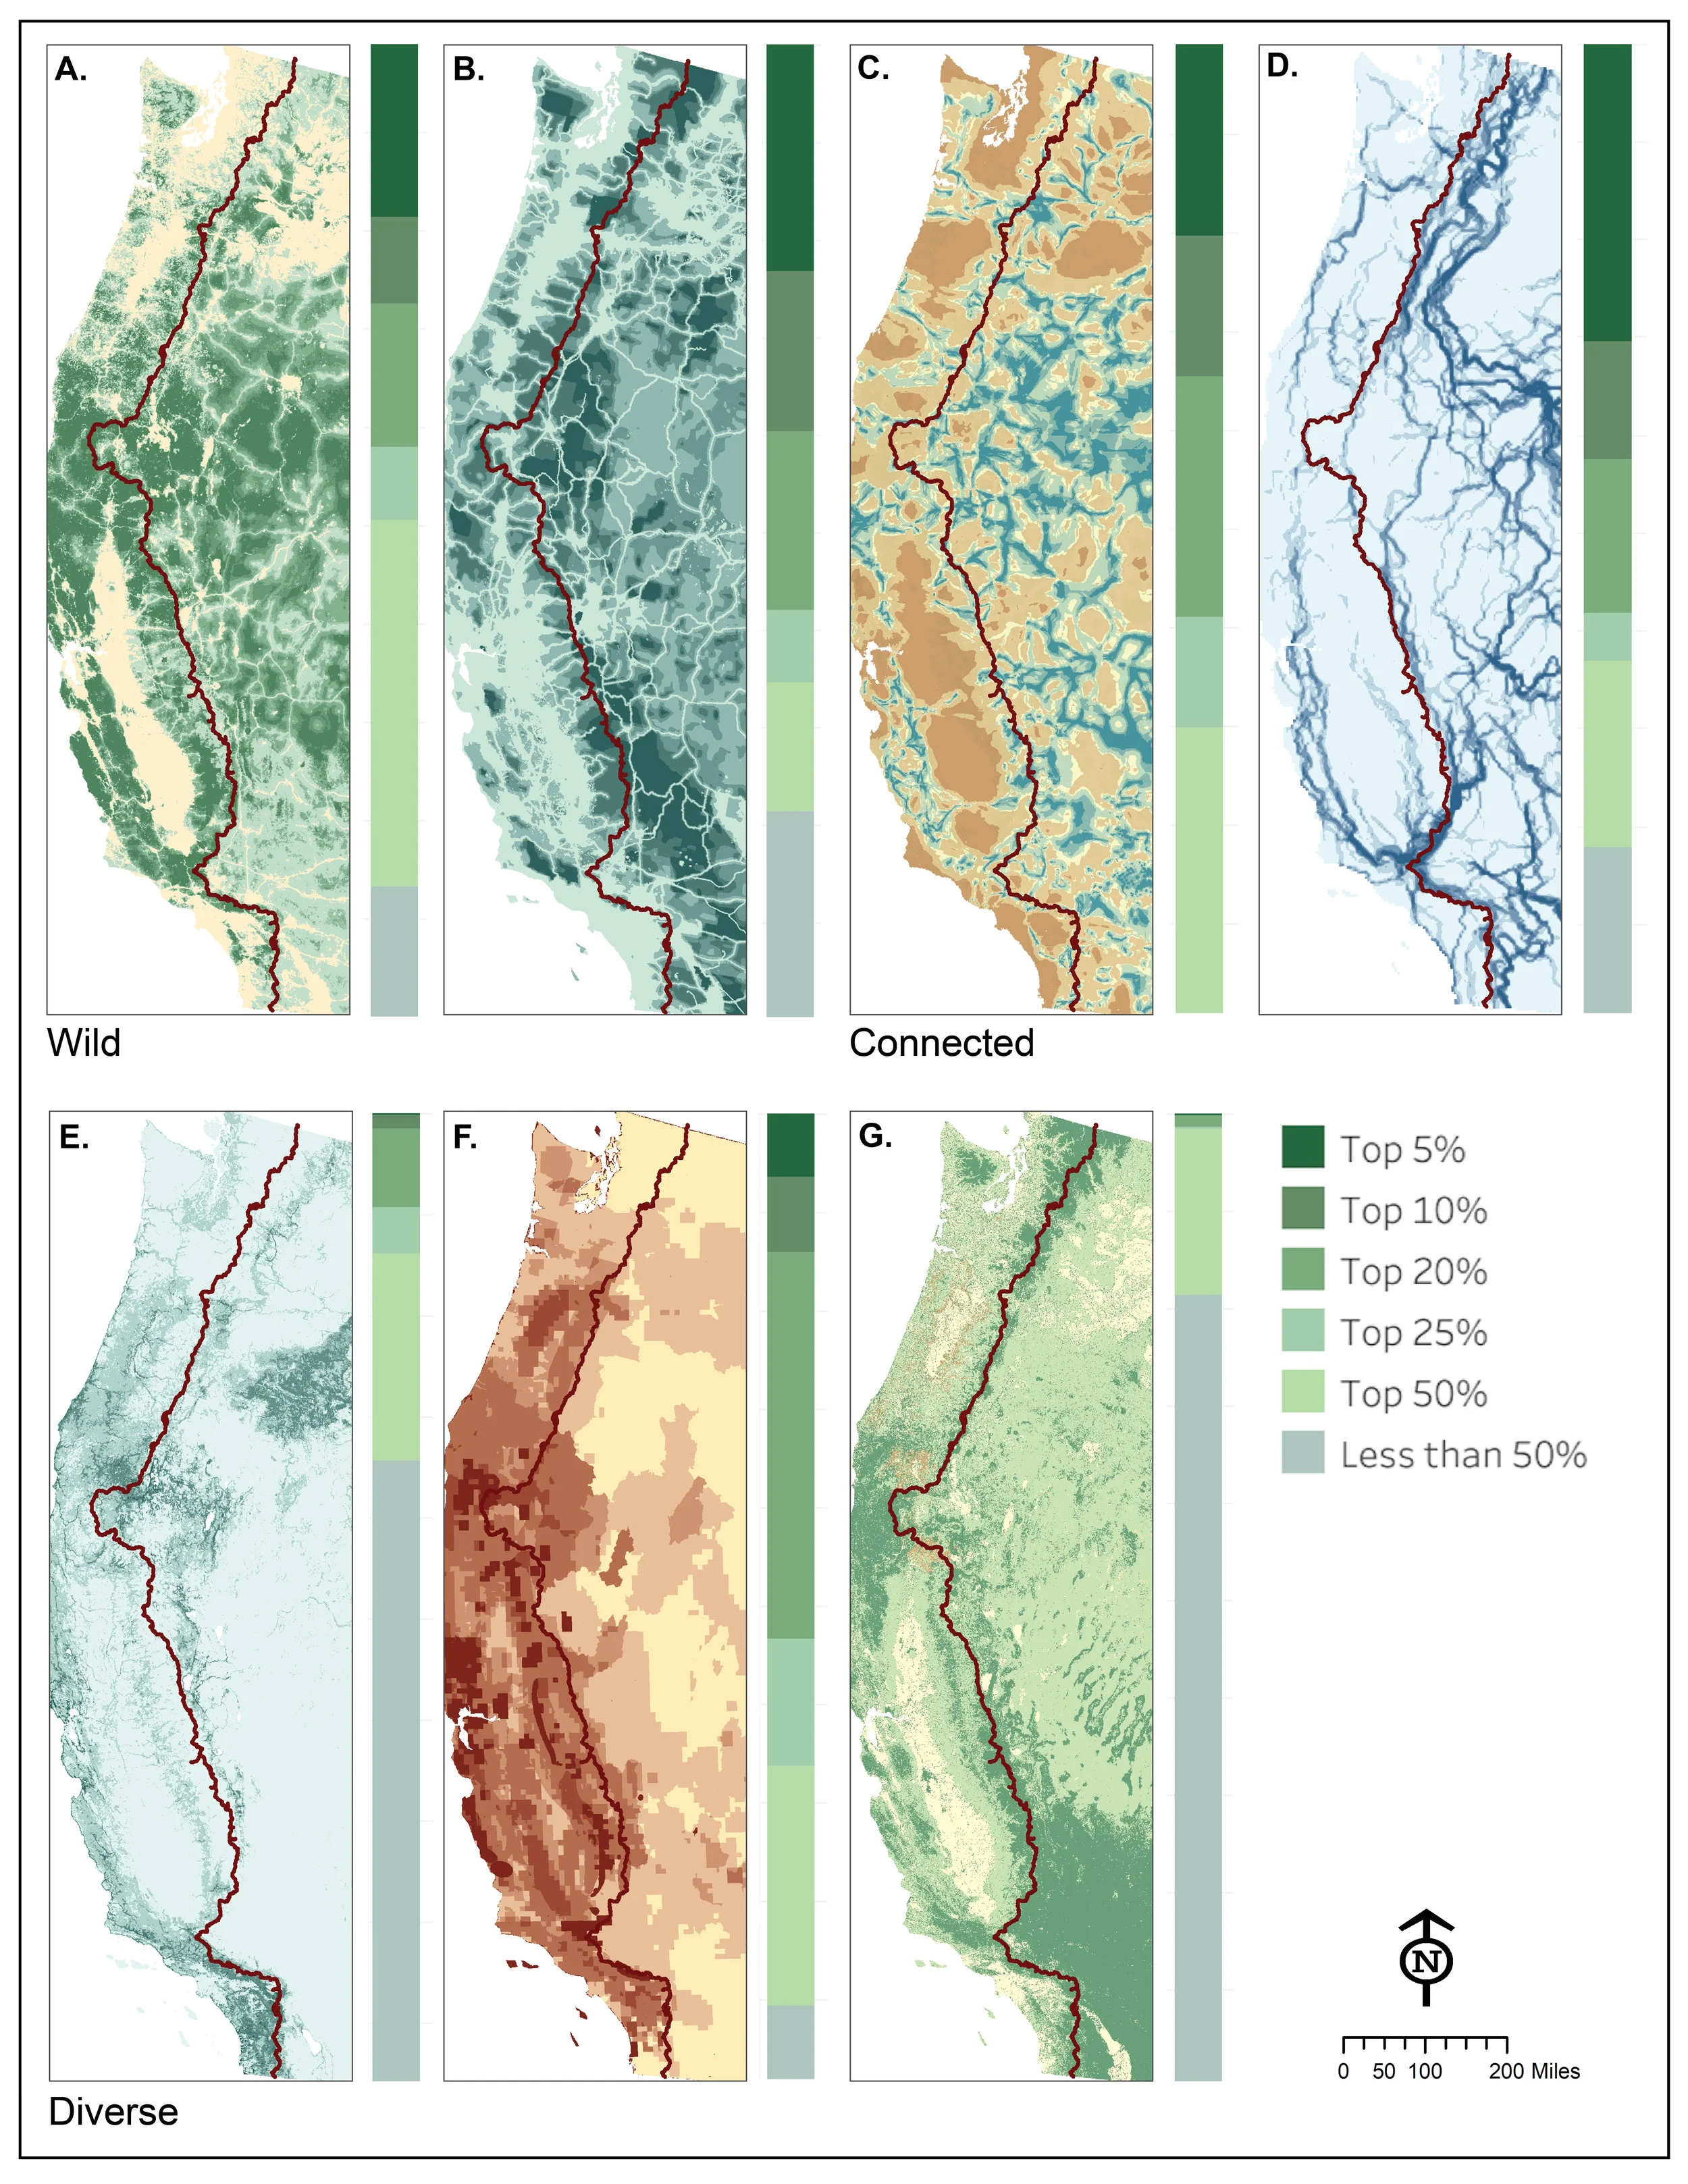
Figure 2. The conservation value of the Pacific Crest Trail.

Figure 5. Potential protected area trail network with Pacific Crest Trail and Continental Divide Trails. Wildland value represents a composite of ecological integrity, connectivity, representation of ecosystems, and biodiversity priority (Belote et al., 2017). Only 12% needs to be redesignated (1.5% GAP status 4 and 10.5% unknown).

Figure 3. The conservation value of the Continental Divide Trail.

Figure 6. Sensitivity analysis of greater ecosystem model (GEM) permeability based on alternative models of degrees of wildness. (A) Represents c= 16 curve (B) Represents c= 1 curve and (C) Represents c= (-16) curve. (D) Models a composite of all three representations using a fuzzy sum overlay analysis. Equation for model P =100-99*((1-exp(c*W)/(1-exp(c))), where P is permeability, C is the curve variable, and W is the percent of wildness (Adapted from Keeley, 2016). Protected areas outlined in white represent the focal national park and adjacent wilderness areas.